
Keyword
Earth Science | Oceans | Ocean Circulation | Water Masses
27 record(s)
Type of resources
Topics
Keywords
Contact for the resource
Provided by
Formats
Update frequencies
Status
draft
-
Set of three ESRI grids of mean sea surface height derived from annual and semi-annual temperature and salinity cycles stored in CARS2000. CARS is a set of seasonal maps of temperature, salinity, dissolved oxygen, nitrate, phosphate and silicate, generated using Loess mapping from all available oceanographic data. It covers the region 100-200E, 50-0S, on a 0.5 degree grid, and on 56 standard depth levels. Higher resolution versions are also available for the Australian continental shelf. The data was obtained from the World Ocean Atlas 98 and CSIRO Marine and NIWA archives. It was designed to improve on the Levitus WOA98 Atlas, in the Australian region. These grids have been produced by CSIRO for the National Oceans Office, as part of an ongoing commitment to natural resource planning and management through the 'National Marine Bioregionalisation' project. Variations in onscreen colour representation or printed reproduction may affect perception of the contained data.
-
ESRI grid of mean sea surface currents derived from annual and semi-annual temperature and salinity cycles stored in CARS2000. CARS is a set of seasonal maps of temperature, salinity, dissolved oxygen, nitrate, phosphate and silicate, generated using Loess mapping from all available oceanographic data in the region. It covers the region 100-200E, 50-0S, on a 0.5 degree grid, and on 56 standard depth levels. Higher resolution versions are also available for the Australian continental shelf. The data was obtained from the World Ocean Atlas 98 and CSIRO Marine and NIWA archives. It was designed to improve on the Levitus WOA98 Atlas, in the Australian region. These grids have been produced by CSIRO for the National Oceans Office, as part of an ongoing commitment to natural resource planning and management through the 'National Marine Bioregionalisation' project. Variations in onscreen colour representation or printed reproduction may affect perception of the contained data.
-
The Northern Region Circulation Model was developed as part of the FRDC Surrogates 1 project. It covers the region from Joseph Bonaparte Gulf to Torres Strait with a fixed horizontal resolution of 0.05 degrees. Outputs included sea level, currents, bottom stress, and other physical parameters. For this dataset the maximum current velocity (max u & V) were used to create GIS map layers
-
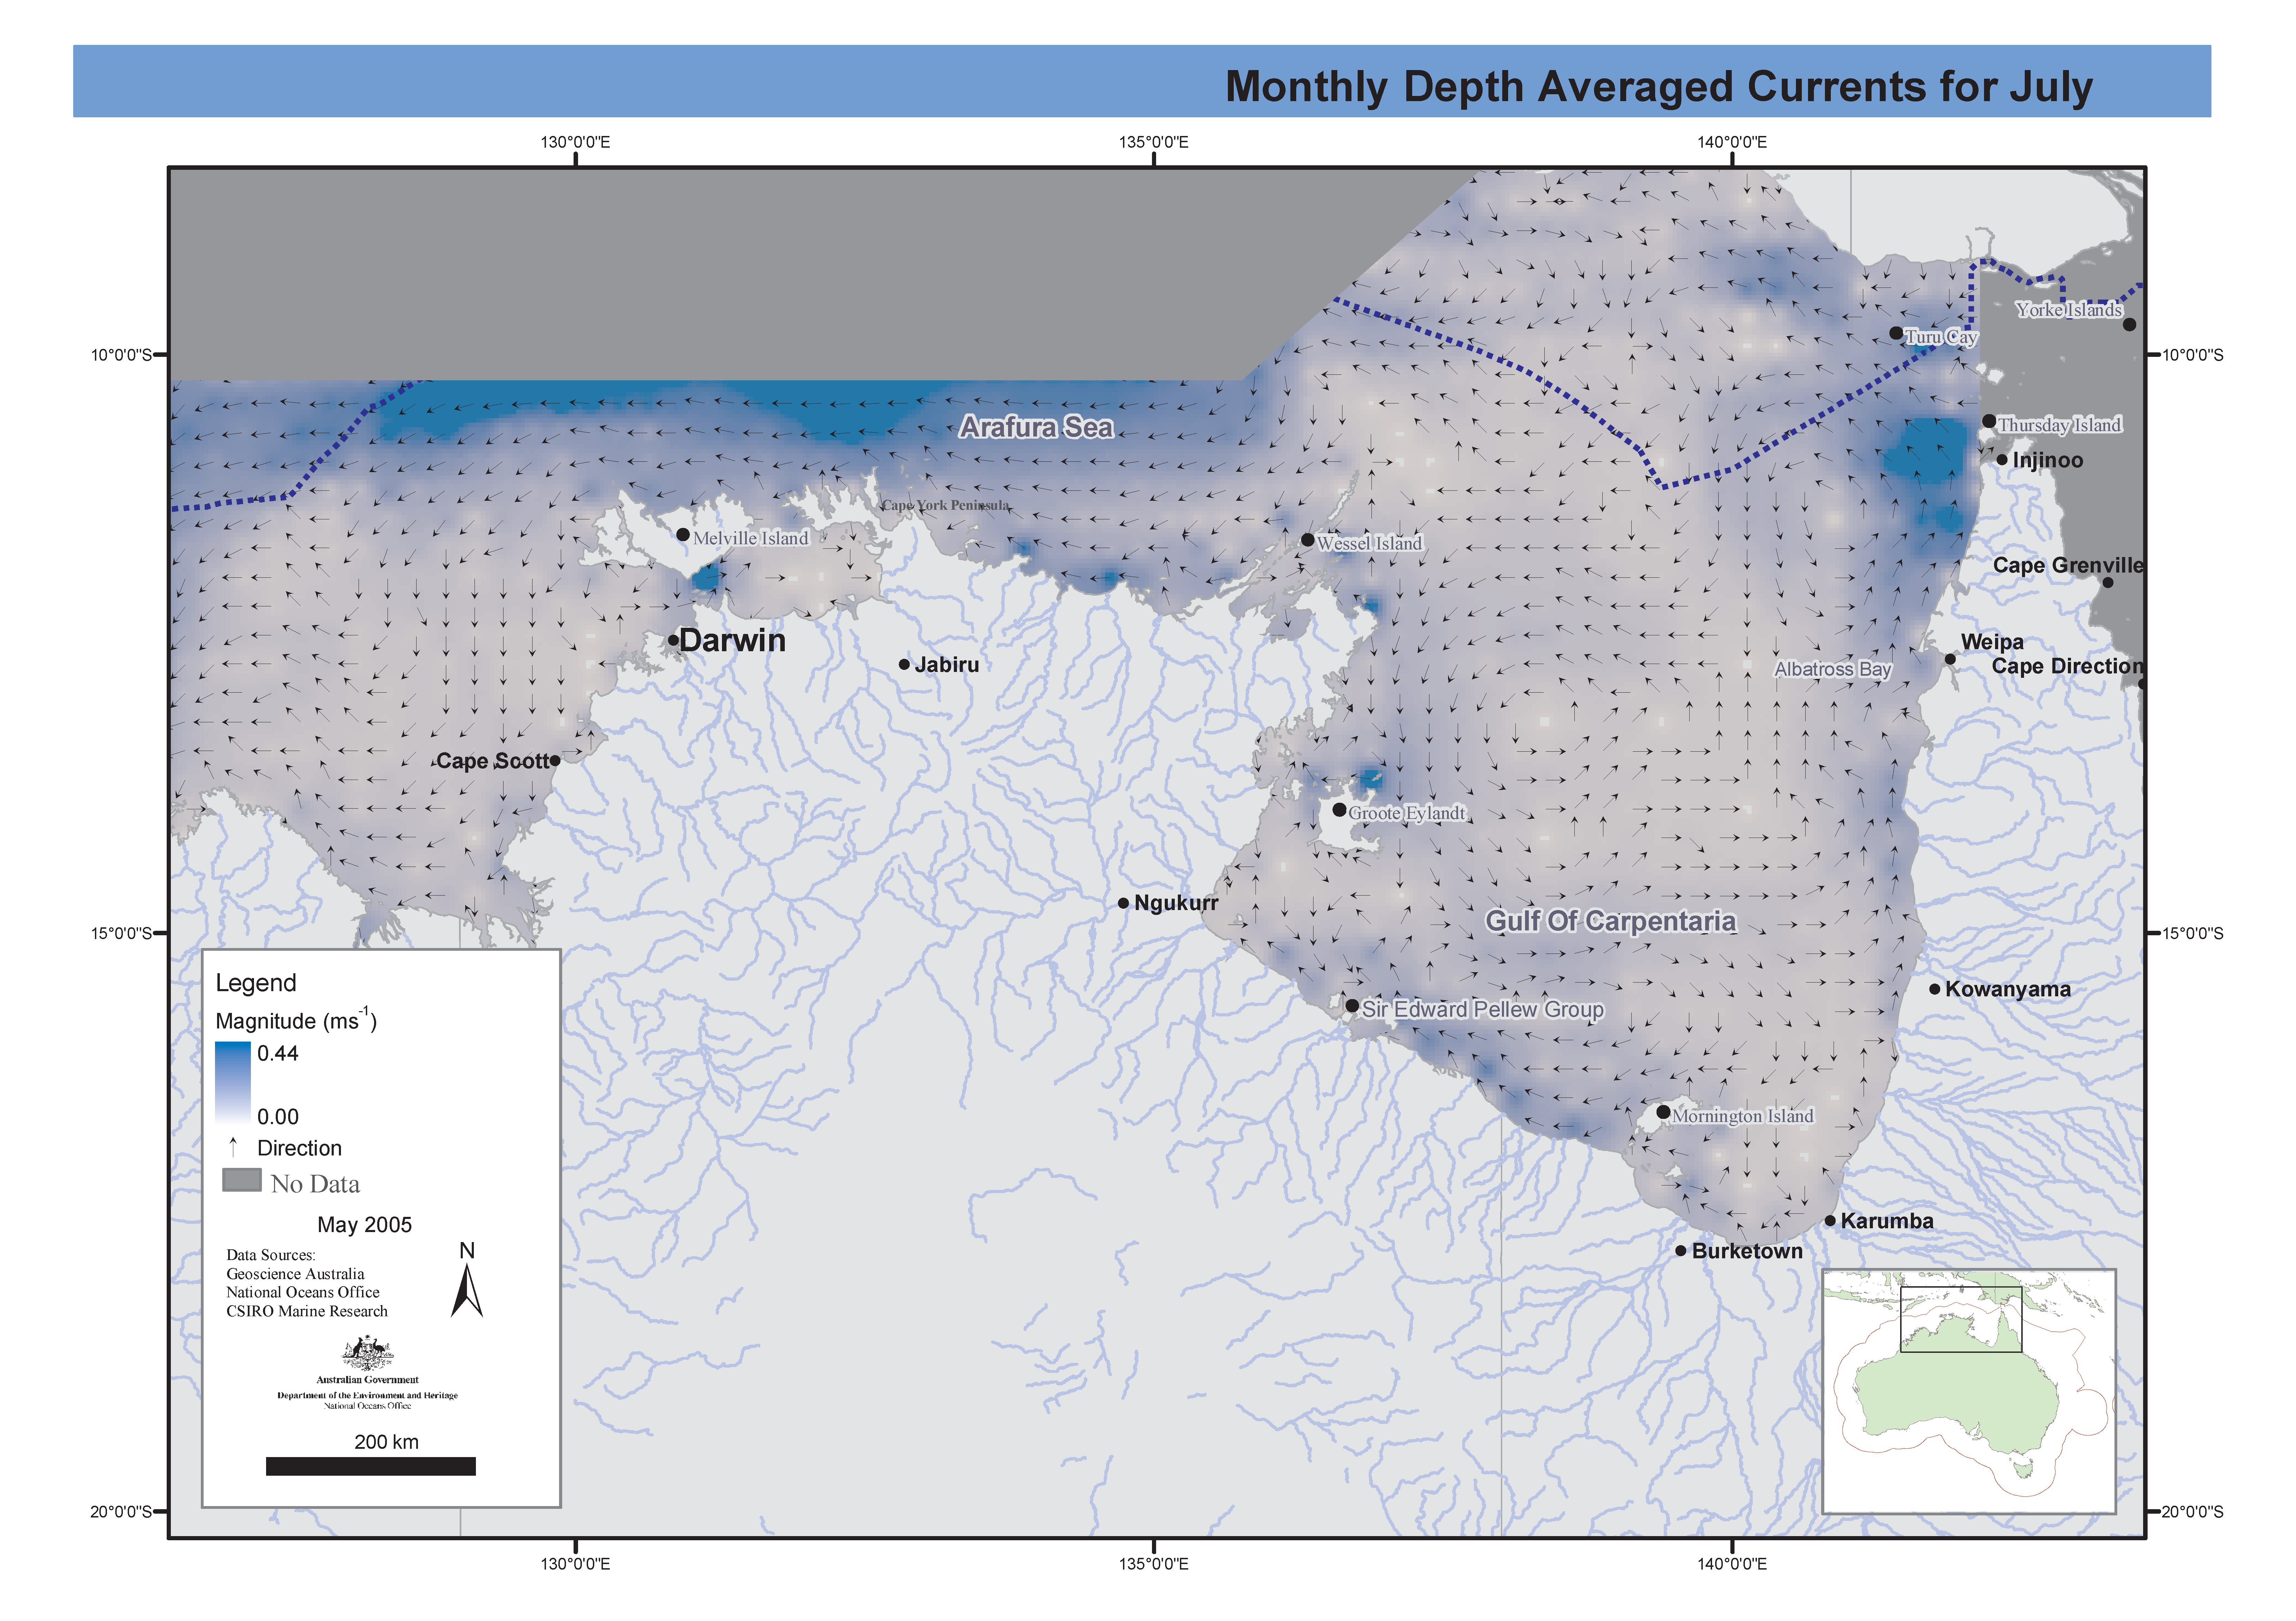
Set of maps showing currents in the Northern Marine Region for the wet (January) and dry (July) seasons. These maps have been produced by CSIRO for the National Oceans Office, as part of an ongoing commitment to natural resource planning and management through the 'National Marine Bioregionalisation' project.
-
The Northern Region Circulation (MECO) Model was developed as part of the FRDC Surrogates 1 project. It covers the region from Joseph Bonaparte Gulf to Torres Strait with a fixed horizontal resolution of 0.05 degrees. Outputs included sea level, currents, bottom stress, and other physical parameters. For this dataset the monthly mean non tidal currents for the Northern Marine Region were used to create GIS map layers.
-
The Northern Region Circulation Model was developed as part of the FRDC Surrogates 1 project . It covers the region from Joseph Bonaparte Gulf to Torres Strait with a fixed horizontal resolution of 0.05 degrees. Outputs included sea level, currents, bottom stress, and other physical parameters. For this dataset the maximum current velocity (max u & V) were used to create GIS map layers
-
ESRI grid and shape files showing magnitude and direction of mean sea surface currents derived from annual and semi-annual temperature and salinity cycles stored in CARS2000. CARS is a set of seasonal maps of temperature, salinity, dissolved oxygen, nitrate, phosphate and silicate, generated using Loess mapping from all available oceanographic data in the region. It covers the region 100-200E, 50-0S, on a 0.5 degree grid, and on 56 standard depth levels. Higher resolution versions are also available for the Australian continental shelf. The data was obtained from the World Ocean Atlas 98 and CSIRO Marine and NIWA archives. It was designed to improve on the Levitus WOA98 Atlas, in the Australian region. These grids have been produced by CSIRO for the National Oceans Office, as part of an ongoing commitment to natural resource planning and management through the 'National Marine Bioregionalisation' project. Variations in onscreen colour representation or printed reproduction may affect perception of the contained data.
-
Australian ocean tide model for the Australian shelf for the region limited by 0 degrees S to 45 degrees S and 109 degrees E to 160 degrees E (Harris et al., 2000). The resolution of the model is 0.067 degrees in both latitude and longitude. This corresponds to 7.4 km at the equator and 5.2 km at the southern-most latitude of the model domain. In the longitude direction, it corresponds to 7.4 km. The linearized, shallow-water, tide model described by Egbert et al. (1994) was used. Dissipation was approximated using a quadratic expression (see line 397 in linked report). In the Bass Strait, the model produced too small amplitudes, which was subsequently compensated for by the data assimilation. The model includes the major eight constituents M2, S2, N2, K2, K1, O1, Q1, P1. The solution was obtained using time stepping on an Arakawa C grid by applying periodic forcing and time stepping from homogeneous initial conditions. The solution was achieved in 10,000 time steps using a step length of 15 s. This corresponds to running the model for roughly 2 days. Along the open boundaries around the edges of the model a global ocean tide model by Andersen et al. (1995; version AG95.1) was used to provide boundary elevations (see also; Shum et al., 1997). This dataset suffers from frequent loss of coverage for several regions in the deep ocean. In these regions it was supplemented with data obtained from the National Geophysical Data Center (NGDC) bathymetry model (Smith and Sandwell, 1997)
-
ESRI grid showing homogeneity, heterogeneity, eddie activity and frontal activity. This grid has been produced by CSIRO for the National Oceans Office, as part of an ongoing commitment to natural resource planning and management through the 'National Marine Bioregionalisation' project.
-
Temperature, linearly interpolated from CARS2000 mean and seasonal fields to 0.1 degree spaced grid, at depths of 0, 150, 500, 1000 and 2000 metres. The loess filter used to create CARS2000 resolves at each point a mean value and a sinusoid with 1 year period (and in some cases a 6 month period sinusoid - the "semi-annual cycle".) The provided "annual amplitude" is simply the magnitude of that annual sinusoid. CARS is a set of seasonal maps of temperature, salinity, dissolved oxygen, nitrate, phosphate and silicate, generated using Loess mapping from all available oceanographic data in the region. It covers the region 100-200E, 50-0S, on a 0.5 degree grid, and on 56 standard depth levels. Higher resolution versions are also available for the Australian continental shelf. The data was obtained from the World Ocean Atlas 98 and CSIRO Marine and NIWA archives. It was designed to improve on the Levitus WOA98 Atlas, in the Australian region. CARS2000 is derived from ocean cast data, which is always measured above the seafloor. However, for properties which do not change rapidly near the seafloor, this would not lead to a significant error. All the limitations of CARS2000 also apply here.